引き続きUdemyでPython for Time Series Data Analysisの学習を進めている。Pandasを用いたTime Series Dataの解析手法に関する内容。
Datetime classの使用例
from datetime import datetime
my_year = 20
my_month = 1
my_day = 2
my_hour = 13
my_min = 30
my_sec = 15
my_date = datetime(my_year,my_month,my_day)
my_date
my_date_time = datetime(my_year,my_month,my_day,my_hour,my_min,my_sec)
type(my_date_time)
my_date_time.hour
np.array(['2020-03-15','2020-03-16','2020-03-17'],dtype='datetime64[h]')
np.arange('1968','1976',dtype='datetime64[D]')
index methodの使用例
import pandas as pd
pd.date_range('Jan 01, 2018',periods=7,freq='D')
pd.to_datetime(['1/2/2018','Jan 03, 2017'])
pd.to_datetime(['2/1/2018','3/1/2018'],format='%d/%m/%Y')
data = np.random.randn(3,2)
cols = ['A','B']
print(data)
idx = pd.date_range('2020-01-01',periods=3,freq='D')
df = pd.DataFrame(data,index=idx,columns=cols)
df
df.index
df.index.max()
df.index.argmax()
df.index.min()
df.index.argmin()
resample methodの使用例
import pandas as pd
df = pd.read_csv('./UDEMY_TSA_FINAL/Data/starbucks.csv',index_col='Date',parse_dates=True)
df.head()
df.index
df.resample(rule='A').mean()
def first_day(entry):
    if len(entry) != 0:
        return entry[0]
df.resample(rule='A').apply(first_day)
df.head()
df['Close'].resample('A').mean().plot.bar()

shiftメソッドの使い方
import pandas as pd
df = pd.read_csv('./UDEMY_TSA_FINAL/Data/Starbucks.csv',parse_dates=True)
df.head()
df.tail()
df.shift(1).tail()
df.shift(-1).tail()
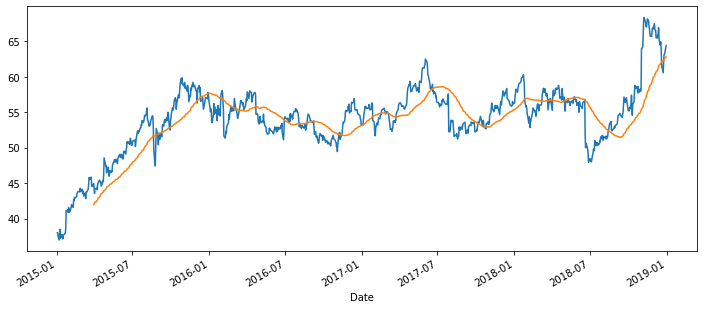
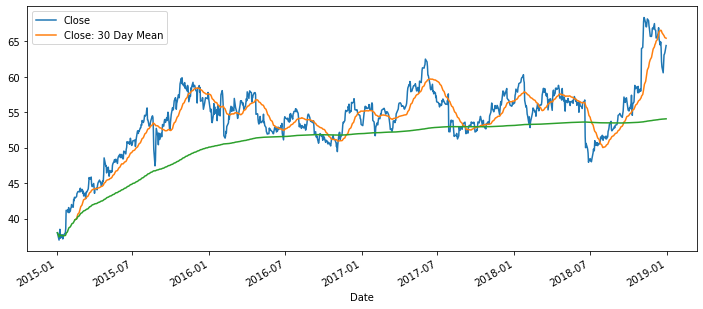
rollingを用いた移動平均線のplot
import pandas as pd
df = pd.read_csv('./UDEMY_TSA_FINAL/Data/Starbucks.csv',index_col='Date',parse_dates=True)
df.head()
df['Close'].plot(figsize=(12,5))
df.rolling(window=60).mean()['Close'].plot()
df['Close: 30 Day Mean'] = df['Close'].rolling(window=30).mean()
df.head
df[['Close','Close: 30 Day Mean']].plot(figsize=(12,5))
df['Close'].expanding().mean().plot(figsize=(12,5))
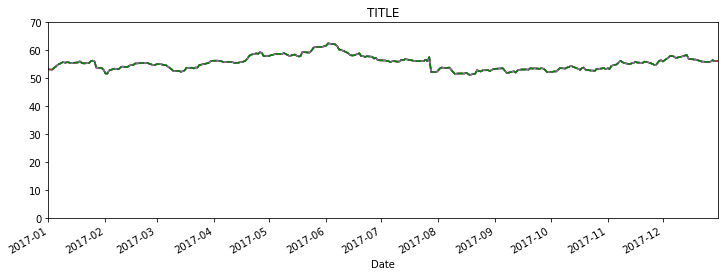
plotの整形
import pandas as pd
df = pd.read_csv('./UDEMY_TSA_FINAL/Data/starbucks.csv',index_col='Date',parse_dates=True)
df.head()
df.index
df['Close'].plot()
df['Volume'].plot()
title = 'TITLE'
ylabel = 'Y LABEL'
xlabel = 'X LABEL'
df['Close'].plot(figsize=(12,6),title=title)
ax.autoscale(axis='both',tight=True)
ax.set(xlabel=xlabel,ylabel=ylabel)
df['Close'].plot(figsize=(12,4))
df['Close']['2017-01-01':'2017-12-31'].plot(figsize=(12,4),xlim=['2017-01-01','2017-12-31'])
df['Close']['2017-01-01':'2017-12-31'].plot(figsize=(12,4),ylim=[0,70],ls='--',c='green')
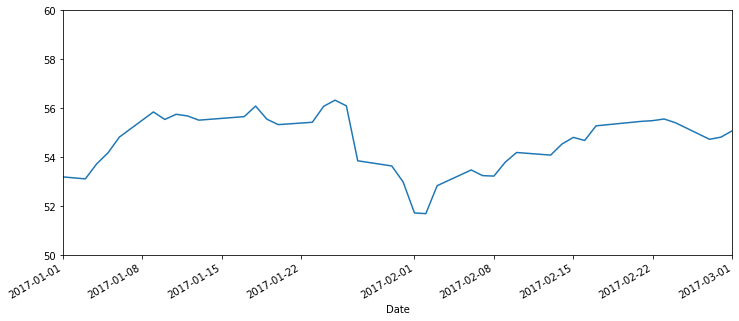
Plotの整形
from matplotlib import dates
df['Close'].plot(xlim=['2017-01-01','2017-03-01'],ylim=[50,60],figsize=(12,5))
ax.set(xlabel='')
ax.xaxis.set_major_locator(dates.WeekdayLocator(byweekday=0))
ax.xaxis.set_major_formatter(dates.DateFormatter('%a-%B-%d'))
ax.xaxis.set_minor_locator(dates.MonthLocator())
ax.xaxis.set_minor_formatter(dates.DateFormatter('\n\n%b'))
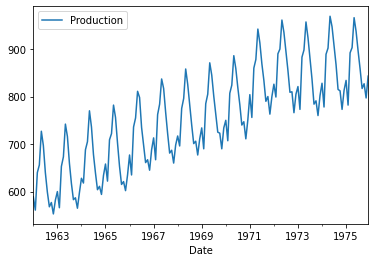
Time Series Dataの可視化
import pandas as pd
pd.read_csv('./UDEMY_TSA_FINAL/Data/monthly_milk_production.csv',encoding='utf8')
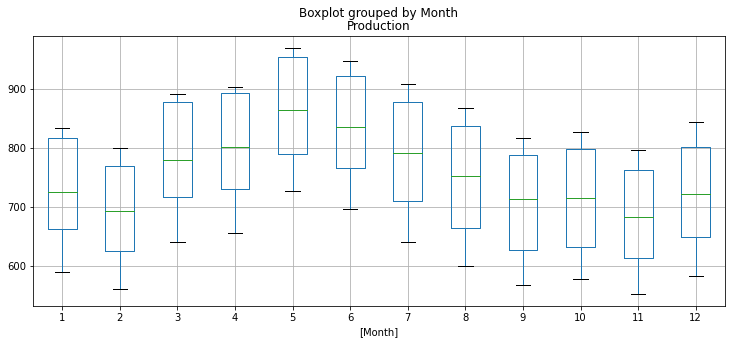
title = "Monthly milk production: pounds per cow. Jan '62 - Dec '75"
print(len(df))
print(df.head())
df.info()
df.dtypes
df['Date'] = pd.to_datetime(df['Date'])
df = df.set_index('Date')
df.head()
df.plot()
df['Month'] = df.index.month
df.head()
df['Month'].index.strftime('%B')
df.head()
df.boxplot(by='Month',figsize=(12,5))
Boxplot
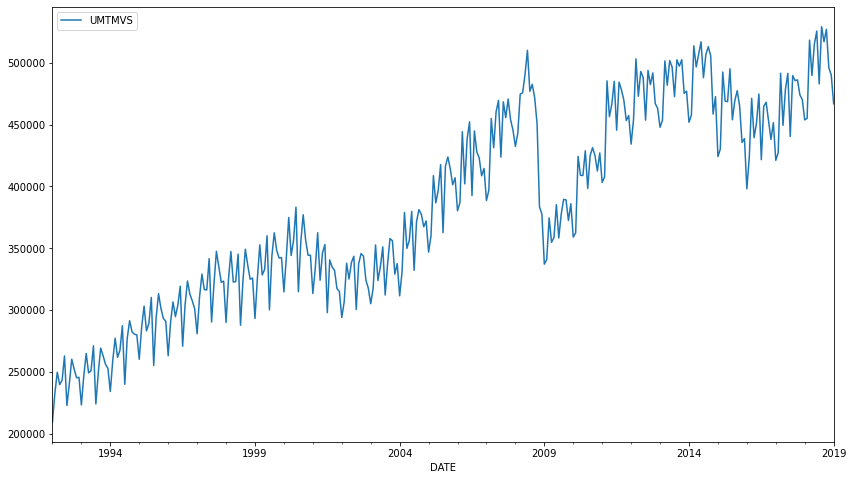
Time Series Dataの整形/可視化
import numpy as np
import pandas as pd
df = pd.read_csv('./UDEMY_TSA_FINAL/Data/UMTMVS.csv')
df.head()
df = df.set_index('DATE')
df.index
df.index = pd.to_datetime(df.index)
df.index
df.plot(figsize=(14,8))
100*(df.loc['2019-01-01'] - df.loc['2009-01-01'])/df.loc['2009-01-01']
df.loc['2005-01-01':].idxmin()
df.sort_values(by='UMTMVS',ascending=False).head(6)
df.loc['2008-01-01'] = df.loc['2009-01-01']
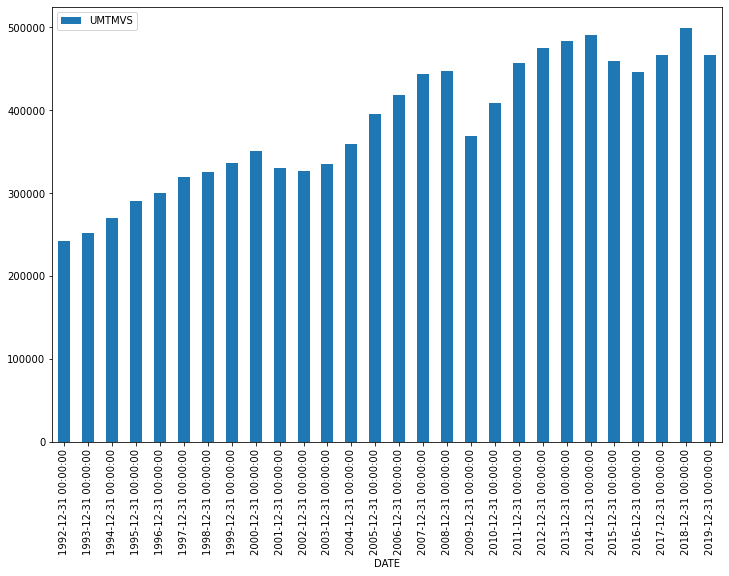
df.resample('Y').mean().plot.bar(figsize=(12,8))
yearly_data = df.resample('Y').mean()
yearly_data_shift = yearly_data.shift(1)
change = yearly_data - yearly_data_shift
change['UMTMVS'].idxmax()
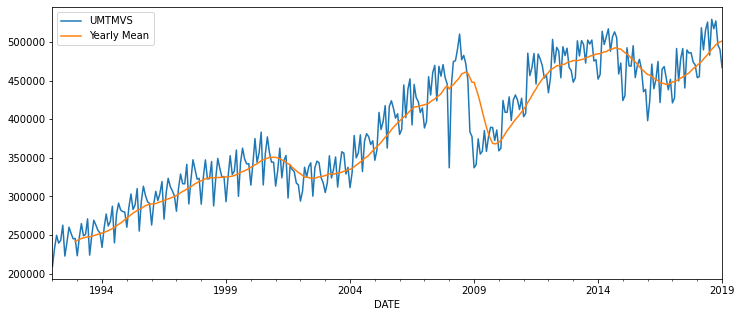
df['Yearly Mean'] = df['UMTMVS'].rolling(window=12).mean()
df.plot(figsize=(12,5))
df = pd.read_csv('./UDEMY_TSA_FINAL/Data/UMTMVS.csv',index_col='DATE',parse_dates=True)
df2008 = df.loc['2008-01-01':'2008-12-01']
df2008.idxmax()
df2008.max()
df_post_peak = df.loc['2008-06-01':]
df_post_peak[df_post_peak>=510081.0].dropna()
len(df.loc['2008-06-01':'2014-03-01'])